Simple Audio Visualizer
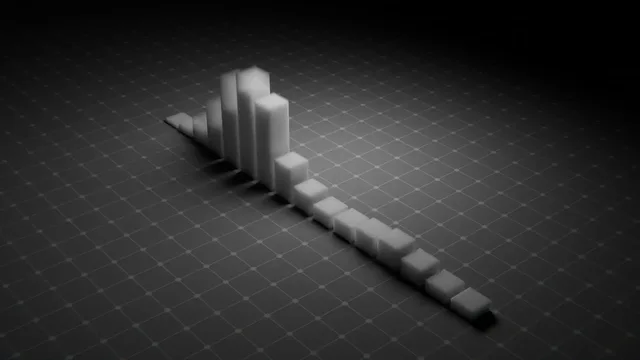
Creates a simple audio visualizer by generating animated cubes that represent the audio spectrum of a selected audio file. Customize the number of visual elements and enable mirror mode for dynamic visual effects.
How to Use:
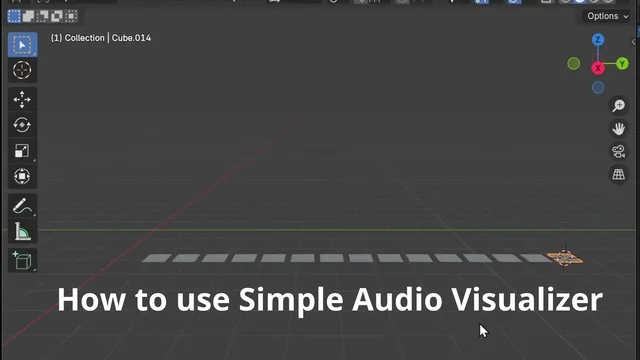
- Open the Graph Editor in Blender.
- Navigate to the Simple Audio Visualizer panel in the sidebar.
- Set the Number of Columns to determine how many visual elements will represent the audio spectrum.
- Choose an Audio File by specifying the path to your desired audio file.
- Enable Mirror Mode if you want to create a mirrored visual effect.
- Click the "Create Visualizer" button to generate the audio visualization.
This extension is based on a script originally created by GitHub user soerenmetje: https://github.com/soerenmetje/Blender-Music-Visualisation-Python-Script
What's New
1.0.0 January 23rd, 2025
Simple Audio Visualizer Initial Release Version 1.0.0
Key Features:
Generate Audio Spectrum Visualization: Creates animated cubes that represent the frequency spectrum of a selected audio file within the Graph Editor workspace.
Adjustable Number of Columns: Customize the number of visual elements (columns) to balance between detail and performance. Higher values provide a more detailed visualization but may increase calculation time.
Mirror Mode Option: Enable mirror mode to offset the origins of the cubes, creating a symmetrical and dynamic visual effect.
I really like this idea, it would be really cool if there was a way to adjust the default height of the cubes so you can easily increase the intensity of the waveform. For now if you want to adjust it normally just go to the first frame and change the value of the Z scale, then apply the scale and repeat that for the other cubes
Very fun LOL


Great work. Any plans for added features?