Add-on Profiler
Add-on Profiler
This project is a reimplementation of the original Plugin-Profiler add-on created by DB3D and improved by rubenmesserschmidt (Plugin-Profiler).
The original posting can be found on the Blender Developer Forums.
About
Add-on Profiler is a Python utility add-on for Blender, providing a convenient and in-software solution to monitor code execution and capture profiling data when needed during add-on development.
Usage
The two main features of the add-on are execution logging and profiling. The tools can be found on the Add-on Profiler tabs of the 3D viewport sidebar.
Logging
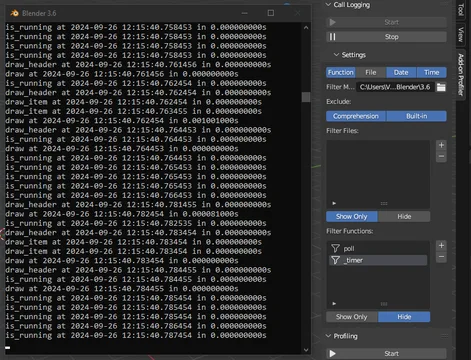
The logging feature makes it possible to monitor all execution calls in the running Python session. The output can be filtered by various options like function names and source files.
By the very nature of this process, the execution is considerably slower, but it makes it possible to catch rampant function calls by inspecting the live logs.
Profiling
The profiling tool utilizes the cProfile and pstats modules to capture profiling data from the execution. The captured data can be formatted and output to the system console, or saved as a profiling data file.
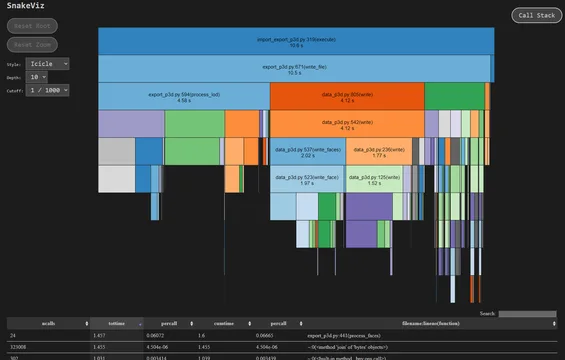
The profiling data (once saved to a file) can be easily visualized with the Snakeviz library. Instructions for the usage of the library can be found in the Snakeviz docs.
Snakeviz has to be installed locally as a separate package.
Installation
This reimplementation is made to be compatible with the new extension system of the Blender 4.2+ releases. Backwards compatibility is known to Blender 2.90.0.
The add-on can be installed from the packaged release like any other add-on. Information on the installation of add-ons can be found in the official Blender Manual.
What's New
2.1.0 October 2nd, 2024
Tested compatibility: Blender 2.90 -> 4.2
Added
- Filter Time logging option


Very useful addon! Thanks :)